Thinking about a move in Carmel but unsure how the market may shift your plans? You are not alone. The most reliable way to cut through headlines is to focus on three core indicators: inventory, days on market, and price per square foot. In this guide, you will learn what each metric means, how to read it, and how to put the signals to work whether you are buying or selling. Let’s dive in.
How to read Carmel’s market
When you look past list prices and open houses, three numbers reveal the market’s true direction:
- Inventory shows balance between buyers and sellers, which affects leverage and offer terms.
- Days on market (DOM) shows how fast homes go under contract and how quickly you must act.
- Price per square foot (PPSF) normalizes value across different home sizes and helps you compare neighborhoods.
These metrics work best in context. Use rolling 3-, 6-, and 12-month views to smooth seasonality, and segment by property type, price range, and neighborhood. Carmel’s micro-markets behave differently, so what you see in one area may not apply citywide.
Inventory: what it tells you
Inventory is the number of active listings compared to the pace of recent sales. The key measure is months of inventory.
- Definition: Months of inventory = Active listings ÷ Average monthly sales.
- Why it matters: Lower months of inventory means less supply and more competition; higher months means more options and slower absorption.
- Benchmarks to orient your expectations:
- Seller’s market: below about 3 months
- Balanced: about 4 to 6 months
- Buyer’s market: above about 7 months
How to segment for Carmel:
- Property type: Single-family vs condos and townhomes can behave differently.
- Price bands: Under $400k, $400k to $750k, and $750k+ often show distinct dynamics.
- Neighborhoods: Old Town/Arts & Design District, Midtown near the Monon Trail, West Clay/Village of WestClay, areas near Clay Terrace, and newer subdivisions to the north and west can each trend differently.
What to watch:
- Rapid drops in inventory can trigger more bidding and shorter decision windows.
- Rising inventory can lengthen marketing times and increase buyer negotiation room.
Practical use if you are selling:
- In lower inventory, you may have more pricing power, but well-prepped homes still perform best.
- In higher inventory, price strategically from day one and invest in presentation to stand out.
Practical use if you are buying:
- In lower inventory, get pre-approved, watch new listings daily, and be ready with clean, well-timed offers.
- In higher inventory, explore concessions and contingency options and use days on market to calibrate your approach.
Visual to include: Time-series line chart of months of inventory for Carmel (3-month rolling average).
Caption: Months of inventory in Carmel — below about 3 months often favors sellers; above about 6 to 7 months often favors buyers.
Days on Market: speed and urgency
Days on market measures how long a listing takes to go under contract. Most reports show DOM through contract acceptance, not closing.
- Use median, not average, to reduce the impact of outliers.
- Look at rolling 30-, 90-, and 365-day medians to remove noise.
Interpreting the signal:
- Very low median DOM (single digits or low teens) indicates quick absorption and potential multiple offers.
- Rising DOM suggests reduced urgency or mispricing, or a shift toward a more balanced environment.
Segment your DOM view:
- New construction vs resale: Builders may hold inventory differently, which can stretch DOM.
- Price tiers: Higher-end homes can take longer to secure the right buyer during certain cycles.
How to use it:
- Sellers can set an expected marketing cadence and adjust midstream if DOM trends rise.
- Buyers can judge how fast to move. In low DOM conditions, schedule showings early, clarify your offer ceiling, and prepare for escalation language if appropriate.
Visual to include: Time-series line chart of median DOM with an interquartile ribbon.
Caption: Median days on market shows how quickly homes in Carmel are contracting; the ribbon illustrates typical variation.
Price per Square Foot: comparing apples to apples
PPSF lets you compare values across different home sizes. For consistency, use the same square-foot definition across your dataset, ideally above-grade heated living area. If you include finished lower levels, compare only to homes that also include them.
Best practices:
- Use median PPSF for comparisons, and track year-over-year changes to gauge appreciation.
- Compare like with like: by neighborhood, price band, and age of home.
Pitfalls to avoid:
- Do not mix exceptional properties, such as custom estates on large lots, with typical subdivision homes.
- PPSF does not fully account for lot quality, updates, or amenities. Use it as a starting point, then refine with comps.
How to apply it:
- Sellers can anchor initial pricing using neighborhood median PPSF adjusted for condition and features.
- Buyers can spot over- or under-market listings and understand trade-offs across areas of Carmel.
Visual to include: Time-series line or bar chart of median PPSF for single-family homes over 24 months with year-over-year change callouts.
Caption: Median price per square foot over time; ensure a consistent square-foot definition for comparability.
Visual to include: Comparative bar chart of PPSF by neighborhood (latest 12 months) for the 5 to 8 most active areas.
Caption: Neighborhood-level PPSF highlights micro-market differences across Carmel. Note sample sizes for confidence.
Carmel micro-markets to watch
Carmel is a city of distinct neighborhoods, and metrics can diverge across them. A few examples of how to think about variation:
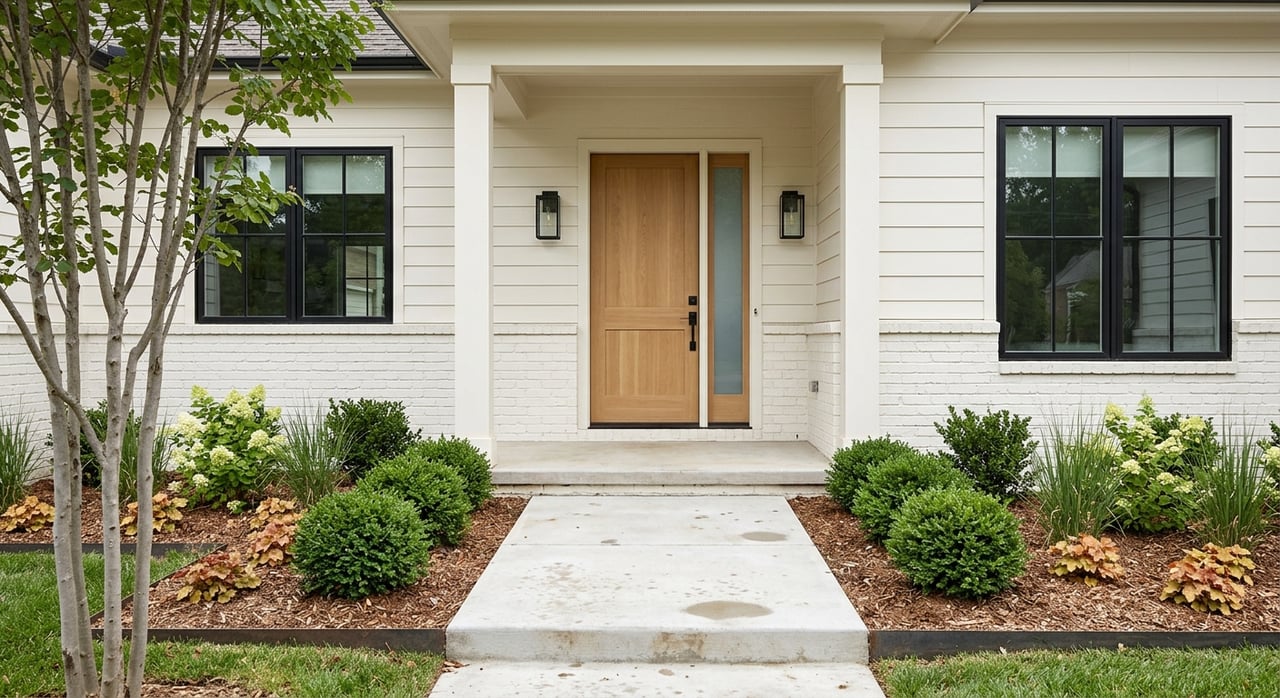
- Old Town and the Arts & Design District: Proximity to restaurants, galleries, and the Monon Trail can attract buyers who value walkability. Expect PPSF and DOM to reflect lifestyle-driven demand.
- Midtown and near the Monon: Newer mixed-use development and trail access can influence absorption. Compare DOM and PPSF to nearby Old Town for a balanced view.
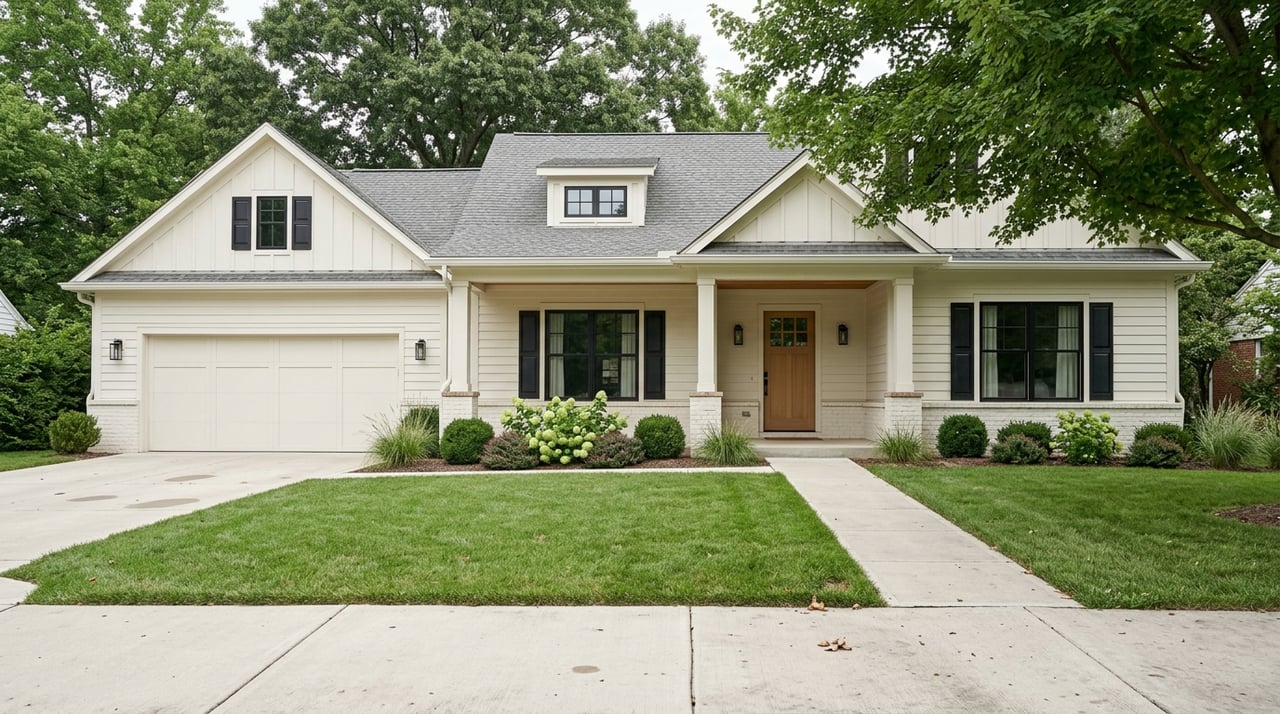
- West Clay and the Village of WestClay: A master-planned environment with amenities can show different inventory dynamics by price band. Segment by home size and age to sharpen your read.
- Near Clay Terrace and corridors with retail access: Convenience can support steady interest; watch DOM trends by product type and price range.
- Northern and western newer developments: New construction can increase choices in certain price bands. Track permits and completions as a forward-looking supply signal.
School zoning within Carmel Clay Schools, commute routes, and amenity access all play into desirability. Reference these factors neutrally when comparing segments, and let the local data lead your conclusions.
Signals of tightening, balancing, or cooling
Use a simple dashboard mindset. The combination of metrics is more powerful than any single data point.
Tightening market signals:
- Months of inventory trending down toward or below about 3
- Median DOM falling
- PPSF and sale-to-list ratios edging up near or above 100 percent
- Pending sales rising faster than new listings
- What it means: Expect more competition and quicker decision windows. Pricing discipline matters for buyers, and polished presentation still pays off for sellers.
Cooling or buyer-leaning signals:
- Months of inventory rising toward or above about 6 to 7
- Median DOM rising
- PPSF flattening or softening
- Sale-to-list ratios dipping below list price
- What it means: Buyers gain leverage on price, terms, and timelines. Sellers should price competitively, consider targeted improvements, and plan for longer market times.
Balanced market signals:
- Months of inventory in the 4 to 6 range
- Moderate, steady DOM
- PPSF growth in line with steady local income and inflation
- What it means: Predictable time to market for sellers, clear comps for pricing, and reasonable negotiation windows for buyers.
Visual to include: Monthly new listings versus pending sales, stacked or side-by-side.
Caption: Comparing new listings to pendings shows supply-demand flow. More pendings relative to new listings suggests tightening conditions.
Action checklists you can use
For sellers:
- Review the 90-day median DOM and sale-to-list ratio for your immediate neighborhood and price band. If DOM is rising, evaluate pricing and condition.
- Use a neighborhood PPSF range plus recent comps to set your launch price. Adjust for updates, lot factors, and any finished lower-level space.
- Prep and present. Certified staging and premium marketing can shorten time to offer in any market.
For buyers:
- Track months of inventory and median DOM for your target price tier and area. If DOM is very low and pendings outpace new listings, pre-approve and tour early.
- Align your offer structure to the data. Consider escalation language, flexible closing, or fewer contingencies only when the segment is truly competitive.
- Use PPSF as a quick screen, then confirm value with full comps, condition, and location factors.
For both sides:
- Watch 30-year mortgage rate trends from reliable sources such as Freddie Mac. Rate moves alter affordability and can shift demand quickly.
- Monitor local building permit activity through city or county sources to gauge future supply.
Methodology and data tips
- Use local MLS reports for Carmel to pull active, pending, and closed counts, median DOM, median sale price, PPSF, and sale-to-list ratios. Ask for both 90-day and 12-month snapshots.
- Rely on medians to reduce the impact of outliers. Compute 3-, 6-, and 12-month rolling medians to smooth seasonality.
- When reporting PPSF, state the square-foot definition and whether finished lower-level space is included. Compare like with like.
- Flag small-sample segments. If a neighborhood has few recent sales, interpret PPSF and DOM with caution.
- For broader context, you can review statewide and national commentary from industry associations and mortgage-rate surveys, but let Carmel-level data guide your decisions.
Plan your next move with local guidance
Whether you are pricing a West Clay home, comparing PPSF near the Arts & Design District, or timing a purchase along the Monon, the right data removes guesswork. If you want a calm, private, and full-service approach to selling or buying in Carmel, you will appreciate the combination of certified staging, premium marketing, relocation coordination, and hands-on guidance.
When you are ready, connect with Tina Smith for a private consultation tailored to your timeline and goals.
FAQs
Is Carmel a buyer’s or seller’s market right now?
- It depends on current months of inventory and median days on market in your price range and neighborhood; below about 3 months leans seller, above about 6 to 7 months leans buyer.
How fast are homes selling in my Carmel neighborhood?
- Check the 90-day median DOM for your specific neighborhood and price tier using local MLS data; use rolling medians and note the number of recent sales for context.
What is a fair price per square foot for my home?
- Start with your neighborhood’s 12-month median PPSF for similar properties and adjust for condition, lot characteristics, updates, and any finished lower-level space.
Should I expect multiple offers on a Carmel home now?
- Low months of inventory, falling median DOM, and sale-to-list ratios near or above 100 percent increase the odds of multiple offers in your segment.
How do mortgage rates affect Carmel home prices and speed?
- Higher rates reduce purchasing power, which can cool demand and increase inventory, while lower rates can boost demand and shorten days on market.
Will new construction change inventory in Carmel soon?
- Track building permits and completions from local planning and permitting sources; more new builds typically add supply that can affect months of inventory over time.